From the Bar Graphs - Contributions and Expenditures page, users can select options to use in generating a bar graph.

IMPORTANT: There are three important items about generating Bar Graphs that are addressed on this page:
1.Bar Graphs display data for an individual candidate and the candidate's principle candidate committee, if the candidate has designated a principle committee. Data from PACs, Organizations, and Political Parties are not obtainable from this view.
2.Data is refreshed every two (2) hours. Data recently Filed or Published may not appear until the next refresh.
3.To view graphs, the user must have Adobe Flash Player installed on the computer. The Can't See the Graph? link provides the user with a link to Adobe's website.
The table below lists the fields, buttons, links, etc. on this screen. Fields that are marked with an asterisk (*) are required fields to build a graph.
Fields and Drop-Down Lists
Election Year Cycle (YYYY) |
Enter the specific election year to use in building the graph. (Required) |
|---|---|
Office Sought |
Select the office or position to use in building the graph. (Required) |
Party |
Select the name of the party to use in building the graph. (Optional) If no party is selected, the information for all parties for the selected year and office is shown on the resulting graph. |
Buttons
Submit |
Begins the graph creation based on your criteria. The graph is displayed on the screen below the criteria fields. |
|---|---|
Clear |
Clears the fields and selections, returning the screen to the defaults. |
Bar Graph Results
Once the criteria has been selected, the user is presented with the representation of the findings.
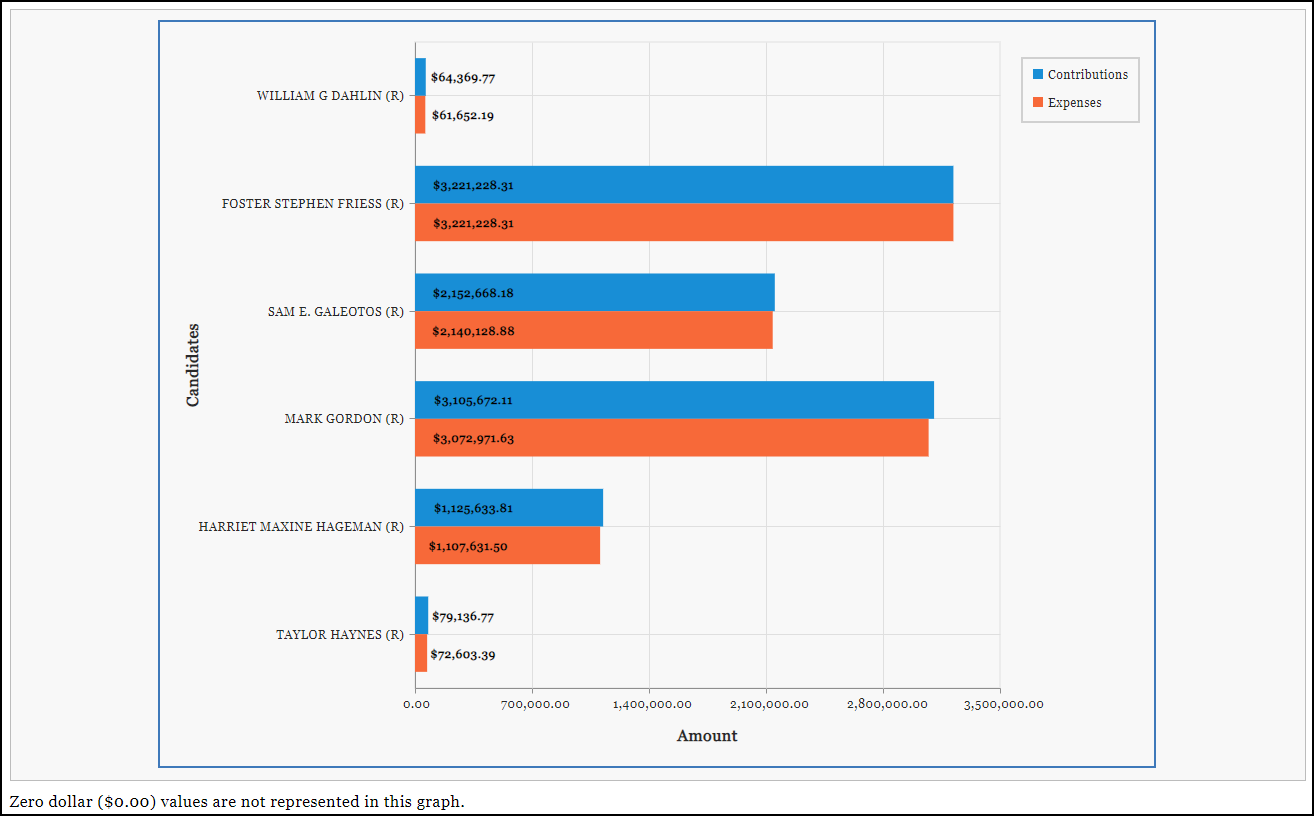
The graph above is reflective of the 2018 Election Year Cycle for the Office of the Governor. You can see that the graph illustrates the contributions and expenditures for the six Republican candidates in 2018.
If the user hovers over the actual bar portion, the total amount associated to that bar is easily readable. In addition, you can toggle the contributions and expenditures on and off by clicking on a value in the Legend.